

SUGAR CROPS RESEARCH PROGRAM
NARC, Islamabad
INTRODUCTION
The Coordinated Research Program on Sugar Crops was initiated in 1982 at National Agricultural Research Center (NARC) initially with 3 Provincial Units: i) Sugarcane Research Institute, Ayub Agricultural Research Institute (AARI) Faisalabad (Punjab), ii) Sugar Crops Research Institute, Mardan, (NWFP) and Agricultural Research Institute, Tandojam (Sindh). Later on, research activities of Sugar Crops Research Program were extended to Balochistan, and the 4th Provincial Sugar Crops Research Unit was established at Govt. Seed Farm, Usta Muhammad in 1996. However, no sugar mill was established during that period in Balochistan, and disposal of sugar crops became a serious problem that affected the research activities of the provincial unit on large scale. Therefore, the unit in Balochistan was closed and all research resources were shifted to Quaid-e-Awam Agricultural Research Institute (QAARI), Larkana (Sindh) in 2002. Then, the 5th Provincial Coordinating Unit of Sugar Crops was established at Sugarcane Breeding Station Dargai, (Malakand Agency) in 2002 to cover ecology of northern part of NWFP. Later on, the 6th Provincial Coordinating Unit was established in 2003 at Agricultural Research Institute, D. I. Khan (NWFP) to cover Southern Ecology of NWFP after opening of Chashma Right Bank Canal (CRBC).
Crop Importance
Sugar in Pakistan is manufactured from cane and beet, although cane is the main and overwhelming raw material used. There is about 1 million hectares of land under cane and beet in four provinces: Punjab, Sindh, North West Frontier Province (NWFP), and Baluchistan. Punjab and Sindh, cane-growing areas, contribute with about 90 percent of the total area and production.
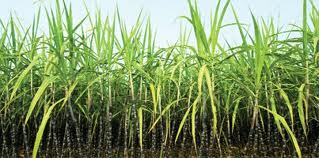
Sugarcane is an important cash crop in many tropical and sub tropical countries accounts for over 2/3 of world sugar production. In Pakistan, sugarcane is an important and high value cash crop. It is mainly grown for sugar and sugar related production. It is an important source of income and employment for the farming community of the country. The sugar industry plays a pivotal role in the national economy of our country. Sugarcane provides sugar, besides bio fuel, fiber, organic fertilizer, chipboard, paper and many other by-products / co-products with ecological sustainability. Its share in value added of agriculture and gross domestic production are 3.7 percent and 0.8 percent, respectively. During 2010-11 season sugarcane was cultivated on an area of 1.241 million hectares, 20.6 percent higher than the previous year. Sugarcane production for the year 2011-12 is estimated at 58.0 million tons in contrast to last year’s production 55.3 million tons. This indicates significant improvement of 16.8 percent over the production of last year.
Sugar beet is grown and processed in the North West Frontier Province (NWFP). Sugar beet is an important sugar crop in the world. It provides almost 30% of the world sugar for human consumption. Table 8 describes the important beet growing countries and their yield potentials. Sugar beet is also an important cash and sugar crop of Khyber Pakhtoon Khawah (KPK). It is considered to be an alternate sugar crop of the region. The crop has the peculiarity of giving as much yield per acre as that of sugar cane but with 20-25 percent higher recovery just in 7 months crop season. Thus sugar beet ensures higher sugar production per acre per month.
Statistics
Top ten sugarcane producers (2009-FAO)
|
Country |
Production |
|
672.157 |
|
|
285.029 |
|
|
116.251 |
|
|
66.816 |
|
|
50.045 |
|
|
49.492 |
|
|
38.500 |
|
|
32.500 |
|
|
30.284 |
|
|
29.000 |
|
|
World |
1,743.068 |
Area, production and yield of sugar beet in the world
| Country
|
Area (000 ha) |
Production (000 ton) |
Yield (ton/hectare) |
|
Germany |
387 |
25,919 |
67.4 |
|
France |
373 |
34,913 |
93.6 |
|
UK |
140 |
8,330 |
59.5 |
|
Netherlands |
73 |
5,735 |
78.6 |
|
Italy |
61 |
3,308 |
54.2 |
|
Turkey |
324 |
17,275 |
53.3 |
|
Poland |
200 |
10,849 |
54.2 |
|
Russia |
770 |
24,892 |
32.3 |
|
Ukraine |
320 |
10,068 |
31.4 |
|
World |
28,174 |
19,12,973 |
67.9 |
Sugarcane Plantation Area, Production Yield and Utilization of Sugarcane by Sugar Mills National
|
Year |
Area |
Production |
Yield |
Utilization %age |
|
1990-91 |
883,800 |
35,988,700 |
40.72 |
62.80 |
|
1991-92 |
879,800 |
34,204,000 |
38.90 |
72.49 |
|
1992-93 |
884,600 |
38,058,900 |
43.02 |
71.66 |
|
1993-94 |
962,800 |
44,427,000 |
46.14 |
76.93 |
|
1994-95 |
1,009,000 |
47,168,400 |
46.75 |
72.49 |
|
1995-96 |
963,100 |
45,229,700 |
47.00 |
62.24 |
|
1996-97 |
964,500 |
41,998,400 |
43.54 |
65.13 |
|
1997-98 |
1,056,200 |
53,104,200 |
50.28 |
77.32 |
|
1998-99 |
1,155,100 |
55,191,100 |
47.78 |
77.90 |
|
1999-00 |
1,009,800 |
42,000,000 |
41.59 |
69.00 |
|
2000-01 |
960,000 |
43,620,000 |
45.41 |
67.47 |
|
2001-02 |
999,700 |
48,041,000 |
48.06 |
76.33 |
|
2002-03 |
1,099,700 |
52,049,000 |
47.33 |
80.28 |
|
2003-04 |
1,074,700 |
53,800,000 |
50.00 |
81.19 |
|
2004-05 |
966,600 |
43,533,000 |
45.04 |
73.74 |
|
2005-06 |
906,980 |
44,292,000 |
48.80 |
67.94 |
|
2006-07 |
1,029,000 |
54,871,000 |
53.00 |
73.78 |
|
2007-08 |
1,241,300 |
63,920,000 |
51.49 |
82.60 |
|
2008-09 |
1,029,400 |
50,045,400 |
48.60 |
66.21 |
|
2009-10 |
942,870 |
49,372,900 |
52.36 |
70.09 |
|
2010-11 |
987,700 |
55,442,100 |
56.13 |
80.47 |
Punjab
|
Year |
Area |
Production |
Yield |
Utilization %age |
|
1990-91 |
525,600 |
19,633,400 |
37.35 |
61.60 |
|
1991-92 |
516,900 |
18,580,800 |
35.95 |
63.21 |
|
1992-93 |
536,100 |
20,044,800 |
37.39 |
67.02 |
|
1993-94 |
596,200 |
24,510,000 |
41.11 |
81.87 |
|
1994-95 |
656,700 |
28,268,000 |
43.00 |
74.20 |
|
1995-96 |
605,600 |
26,880,000 |
44.40 |
63.22 |
|
1996-97 |
604,200 |
24,010,200 |
39.74 |
67.86 |
|
1997-98 |
685,300 |
32,110,600 |
46.86 |
80.67 |
|
1998-99 |
780,300 |
33,382,800 |
42.78 |
78.12 |
|
1999-00 |
672,100 |
25,000,000 |
37.20 |
67.32 |
|
2000-01 |
615,000 |
26,740,000 |
43.48 |
67.57 |
|
2001-02 |
657,000 |
31,803,000 |
48.40 |
79.40 |
|
2002-03 |
735,000 |
33,169,000 |
45.12 |
83.15 |
|
2003-04 |
709,000 |
34,419,000 |
49.00 |
83.10 |
|
2004-05 |
645,000 |
29,332,000 |
45.47 |
77.65 |
|
2005-06 |
625,200 |
28,949,000 |
46.30 |
66.81 |
|
2006-07 |
712,000 |
37,542,000 |
53.00 |
70.85 |
|
2007-08 |
872,200 |
40,306,000 |
48.73 |
81.90 |
|
2008-09 |
666,500 |
32,294,700 |
48.50 |
64.02 |
|
2009-10 |
607,420 |
31,324,000 |
51.60 |
66.95 |
|
2010-11 |
672,200 |
37,481,000 |
55.75 |
74.37 |
Sindh
|
Year |
Area |
Production |
Yield |
Utilization %age |
|
1990-91 |
253,099 |
12,511,135 |
49.43 |
76.71 |
|
1991-92 |
255,280 |
14,240,476 |
55.78 |
83.00 |
|
1992-93 |
248,000 |
13,556,800 |
54.66 |
93.85 |
|
1993-94 |
265,800 |
15,420,000 |
58.01 |
84.51 |
|
1994-95 |
249,700 |
14,310,300 |
57.30 |
84.12 |
|
1995-96 |
254,400 |
13,737,200 |
54.00 |
75.28 |
|
1996-97 |
251,200 |
13,110,600 |
52.19 |
78.68 |
|
1997-98 |
261,600 |
15,990,600 |
61.16 |
86.58 |
|
1998-99 |
270,800 |
17,050,700 |
62.96 |
88.53 |
|
1999-00 |
230,600 |
12,100,000 |
51.27 |
83.99 |
|
2000-01 |
239,000 |
12,050,000 |
50.42 |
87.08 |
|
2001-02 |
241,000 |
11,416,000 |
47.37 |
89.90 |
|
2002-03 |
259,000 |
13,798,000 |
53.27 |
89.98 |
|
2003-04 |
260,000 |
14,612,000 |
56.00 |
88.90 |
|
2004-05 |
215,000 |
9,357,000 |
43.52 |
84.59 |
|
2005-06 |
183,180 |
11,243,000 |
61.40 |
81.67 |
|
2006-07 |
215,000 |
12,529,000 |
58.00 |
92.80 |
|
2007-08 |
308,800 |
18,793,900 |
60.86 |
89.05 |
|
2008-09 |
263,900 |
13,304,300 |
50.40 |
76.28 |
|
2009-10 |
233,950 |
13,505,400 |
57.70 |
85.04 |
|
2010-11 |
226,500 |
13,900,000 |
60.43 |
97.84 |
Khyber Pakhtunkhwa
|
Year |
Area |
Production |
Yield |
Utilization %age |
|
1990-91 |
104,600 |
4,516,100 |
43.17 |
20.18 |
|
1991-92 |
107,000 |
4,563,200 |
42.64 |
23.97 |
|
1992-93 |
99,900 |
4,428,400 |
44.33 |
25.25 |
|
1993-94 |
100,300 |
4,470,000 |
44.57 |
24.25 |
|
1994-95 |
102,100 |
4,562,200 |
44.70 |
25.86 |
|
1995-96 |
102,500 |
4,583,000 |
44.70 |
17.84 |
|
1996-97 |
08,400 |
4,841,600 |
44.66 |
15.38 |
|
1997-98 |
108,600 |
4,956,500 |
45.64 |
26.30 |
|
1998-99 |
03,300 |
4,719,500 |
45.68 |
38.53 |
|
1999-00 |
06,300 |
4,900,000 |
46.10 |
26.40 |
|
2000-01 |
06,000 |
4,800,000 |
45.28 |
17.64 |
|
2001-02 |
01,000 |
4,787,000 |
47.40 |
26.94 |
|
2002-03 |
05,000 |
5,049,000 |
48.08 |
35.40 |
|
2003-04 |
05,000 |
4,745,000 |
45.00 |
43.53 |
|
2004-05 |
06,000 |
4,816,000 |
45.43 |
29.26 |
|
2005-06 |
98,600 |
4,100,000 |
41.60 |
38.23 |
|
2006-07 |
102,000 |
4,800,000 |
47.00 |
46.98 |
|
2007-08 |
04,800 |
4,792,000 |
45.73 |
62.11 |
|
2008-09 |
98,200 |
4,408,500 |
44.09 |
52.48 |
|
2009-10 |
100,800 |
4,507,900 |
44.70 |
47.77 |
|
2010-11 |
88,400 |
4,030,300 |
45.59 |
75.31 |
Beet Sugar Production, Beet Sliced Sugar Made & Recovery by Khyber Pakhtunkhwa Sugar Mills
|
Year |
No of Mills |
Beet Sliced Tons |
Sugar Made Tons |
Recoveries (%) |
|
1990-91 |
03 |
282,103 |
23,312 |
8.26 |
|
1991-92 |
03 |
314,758 |
29,009 |
9.21 |
|
1992-93 |
03 |
214,950 |
18,916 |
8.80 |
|
1993-94 |
04 |
242,482 |
21,933 |
9.05 |
|
1994-95 |
04 |
193,595 |